

The Precision trend histogram is a simple MT4 indicator that tells about the trend’s direction. The indicator plots a histogram below the chart in the bottom window. The histogram consists of red and green bars. The color of the bars indicates the trend’s direction.
Traders can apply the indicator on any timeframe; however, it’s best to apply it on longer timeframes to filter any false signals.
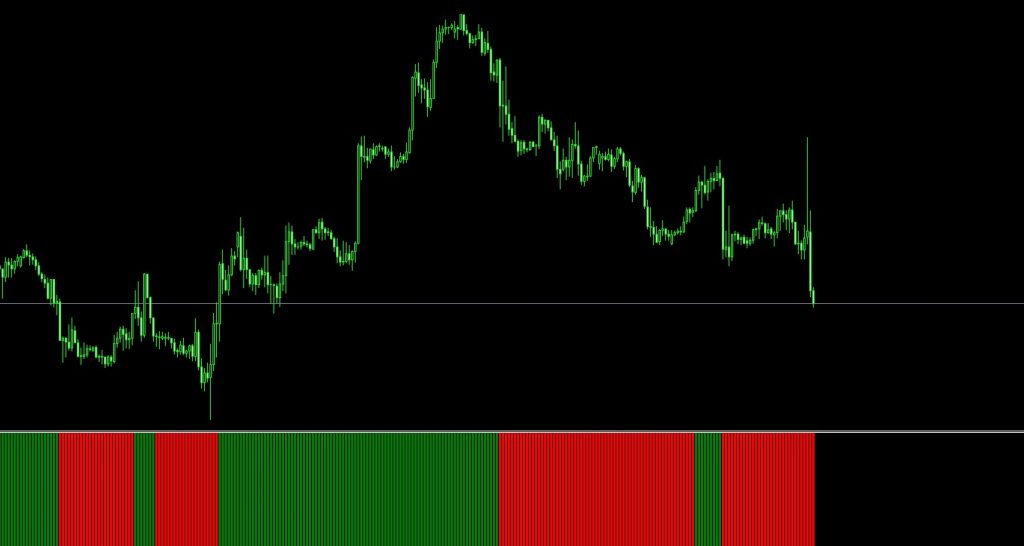
The above EUR/USD H4 chart shows the indicator BUY and SELL signals. To look for BUY and SELL signals, traders need to look at the color of the bars. The indicator plots red bars in a strong downtrend, and traders can enter short positions. Conversely, when the indicator draws green bars, it indicates an uptrend, and traders can enter long positions.
Traders can also use the indicator to find market reversals. When the indicator starts changing colors, it indicates the trend is about to end, and traders need to exit the trades. It’s important to note that sometimes, the indicator doesn’t mention the trend reversals, so traders must wait for the price action to change the course and exit the trades.
The indicator works best on its own, but traders can apply other indicators for further signal confirmation.
Conclusion
The Precision trend histogram plots a histogram comprising red and green bars. By looking at the red and green bars, traders can take their positions or exit the trades. If you want to download the Precision trend histogram, you can download the indicator for free on our website.